1. Conventions
1.1. hexadecimal
hexadecimal can be encoded as explained in colormap.colors.hex2rgb():
#FFF
#0000FF
0x0000FF
0xFA1
1.2. normalisation
By default, input should be normalised (e.g., RGB values between 0 and 1) and outputs are normalised. If you provide unnormalised values (e.g., RGB in 0-255) then set the noramlised parameter to True (see example in codecs).
2. Codecs
2.1. list
There is a bunch of codecs available in colormap.colors such as
hex2rgb:
>>> from colormap.colors import hex2rgb
>>> hex2rgb("#FFF", normalise=False)
(255, 255, 255)
>>> hex2rgb("#FFFFFF", normalise=True)
(1.0, 1.0, 1.0)
codecs |
|
|---|---|
hex2web |
|
web2hex |
|
hex2rgb |
|
rgb2hex |
|
rgb2hls |
|
rgb2hsv |
|
hsv2rgb |
|
hls2rgb |
|
hex2dec |
|
yuv2rgb |
|
rgb2yuv_int |
|
yuv2rgb_int |
2.2. format
RGB (red/green/blue): a triple of values between 0 and 255
HLS (): H in 0-360 and L,S in 0-100
HSV (): H in 0-360, S,V in
YUV: all in 0-1
3. Color class
On task, which is quite common is to know the hexadecimal code of a color known
by name (e.g. red). The colormap.colors.Color would be useful:
>>> c = Color('red')
>>> c.rgb
(1.0, 0.0, 0.0)
>>> c.hls
(0.0, 0.5, 1.0)
>>> c.hex
'#FF0000'

>>> print(c)
Color Red
hexa code: #FF0000
RGB code: (1.0, 0.0, 0.0)
RGB code (un-normalised): [255.0, 0.0, 0.0]

HSV code: (0.0, 1.0, 1.0)
HSV code: (un-normalised) 0.0 100.0 100.0

HLS code: (0.0, 0.5, 1.0)
HLS code: (un-normalised) 0.0 50.0 100.0
Input when instanciating can be anything in RGB, HEX, HLS, common name from
colormap.xfree86:
>>> sorted(colormap.xfree86.XFree86_colors.keys())
4. colormap
There are lots of colormaps in matplotlib. This is great but some may be missing or it is not obvious to know what the colormap will look like.
The colormap.colors.Colormap class allows you:
To build easily new colormaps and visualise them
Visualise existing colormaps
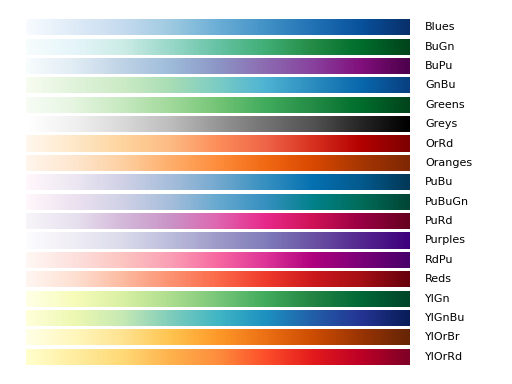
4.1. visualise colormaps
>>> from colormap import plot_category
>>> plot_category('sequentials')
(Source code, png, hires.png, pdf)
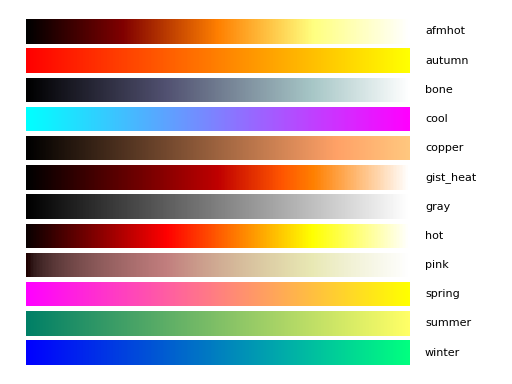
>>> from colormap import plot_category
>>> plot_category('sequentials2')
(Source code, png, hires.png, pdf)
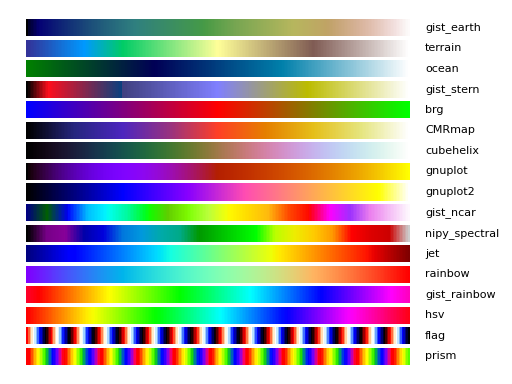
>>> from colormap import plot_category
>>> plot_category('misc')
(Source code, png, hires.png, pdf)
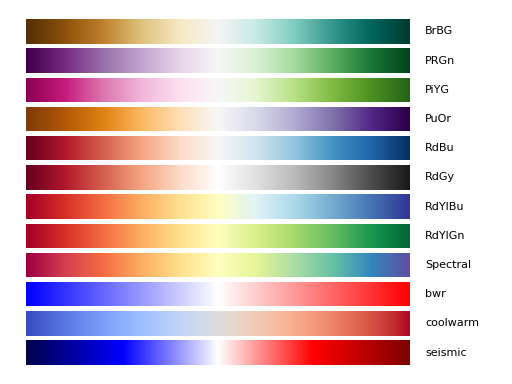
>>> from colormap import plot_category
>>> plot_category('diverging')
(Source code, png, hires.png, pdf)
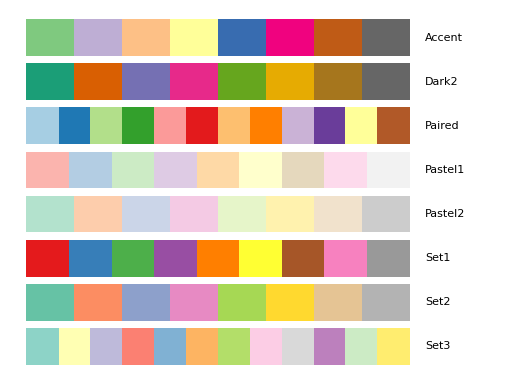
>>> from colormap import plot_category
>>> plot_category('qualitative')
(Source code, png, hires.png, pdf)
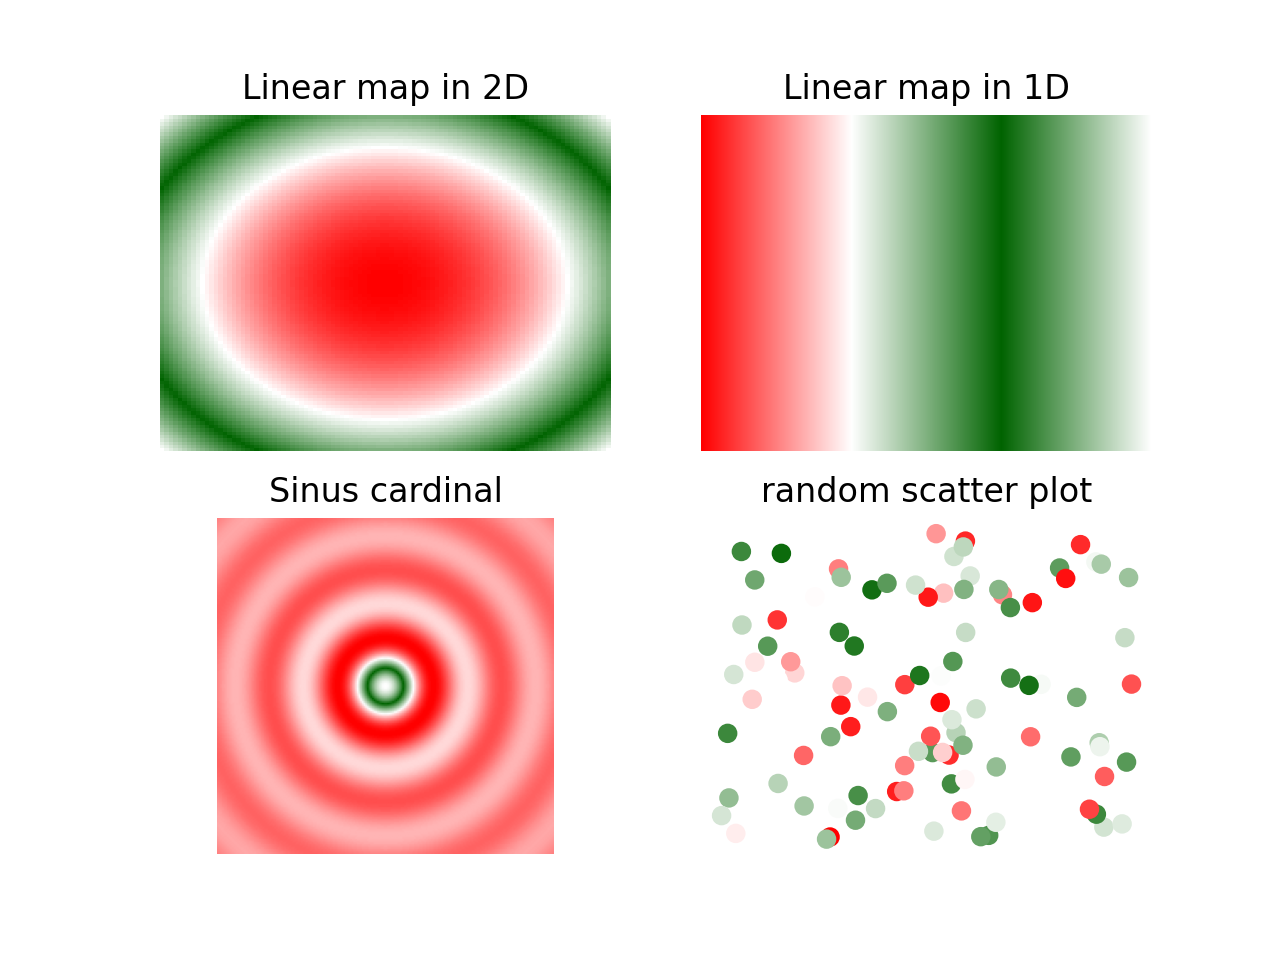
4.2. Visualise existing colormap
>>> from colormap import plot_colormap
>>> plot_colormap("viridis")
(Source code, png, hires.png, pdf)
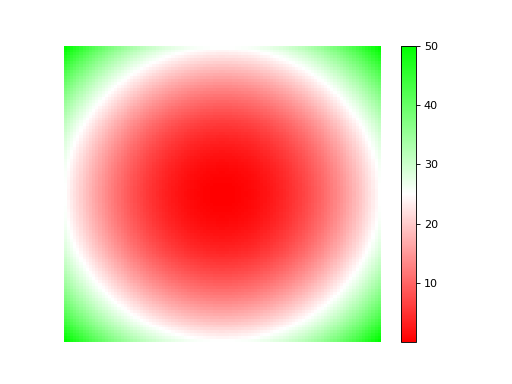
4.3. Create a linear colormap
The simplest colormap are linear with 3 colors. In such case, we provide a method that is easy to use. Imagine you want a colormap from red to green with white color in between:
from colormap import Colormap
c = Colormap()
cmap = c.cmap_linear('red', 'white', 'green')
cmap = c.test_colormap(cmap)
(Source code, png, hires.png, pdf)
Here, we use color names, which are the xfree86 names. However, you could have
used any format accepted by Colors:
red = Color('red')
cmap = cmap_linear(red, 'white', '#0000FF')
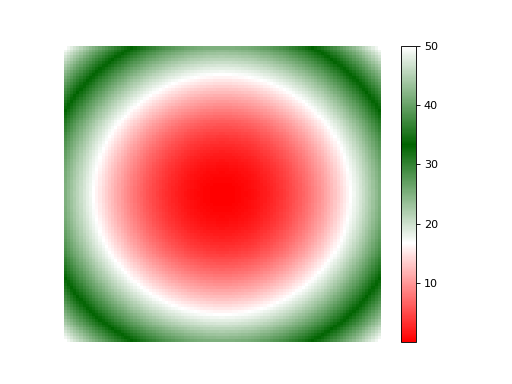
4.4. Create a general colormap
In the previous example, we used 3 colors assuming a linear scale. However, you
may want a different scale, in which case, you need to provide more colors. In
such case, you can use cmap() method.
Here we again use the same example a above but it can be generalised easily. First, we need to know the RGB components of the colors:
>>> from colormap import Color, Colormap
>>> green = Color('Dark Green').rgb
>>> red = Color('red').rgb
>>> white = Color('white').rgb
>>> white
(1.0, 1.0, 1.0)
For instance RGB values of white are 1,1,1
Second, built a dictionary with the three RGB name (red/green/blue) as keys and with the values being the evolution of the red/green/blue when a value goes from 0 to 1. Here, we use a linear scaling so we just need 3 values at 0, 0.5, and 1. Therefore we have list of 4 values. You could provide list of arbitrary lengths if required
>>> c = Colormap()
>>> mycmap = c.cmap( {'red':[1,1,0,1], 'green':[0,1,.39,1],  'blue':[0,1,0,1]})
Finally, test it:
c.test_colormap(mycmap)
(Source code, png, hires.png, pdf)
